Realtime Reporting Metrics in SmartAgent
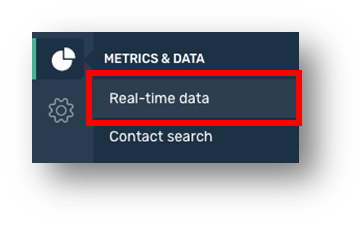
Real-time queue data can be accessed by clicking the Metrics & Data icon in the left-hand menu and selecting Real-time data.
At the top of the page you will see a list of all queues.
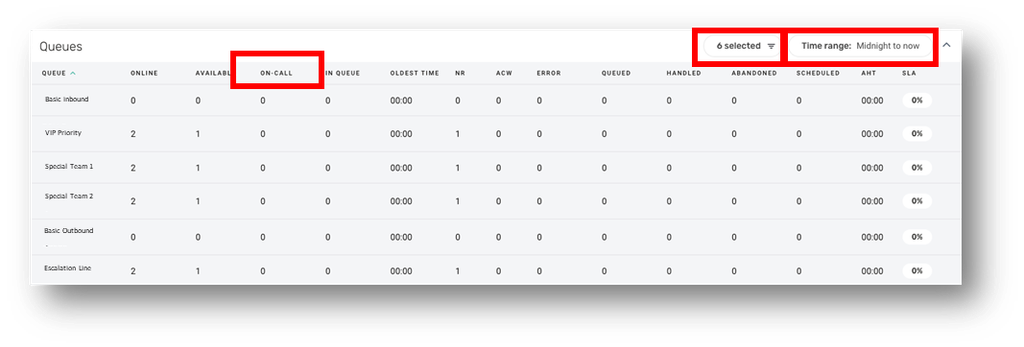
You can filter which Queues report onscreen using the filter icon and change the sorting order by clicking on the column headers.
You can also select a different time range - the default is Midnight to now
Agents Realtime Metrics
Below the Queue data on the real-time data screen you will also see a list of agents currently in an active state.
On this page you can see the agents’s current status, the routing profile they currently have and some indicative data on their performance in the time period selected.
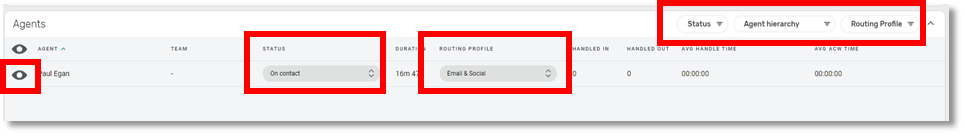
You can filter this list of Agents by their current status, Agent Hierarchy and routing profile.