Historic Reporting Metrics in Amazon Connect
Historic metrics for Queues and Agents are available within the Amazon Connect application. As a supervisor you may be given access to this part of the application. Access may be restricted to just view reports, or you may also have the ability to create and share reports.
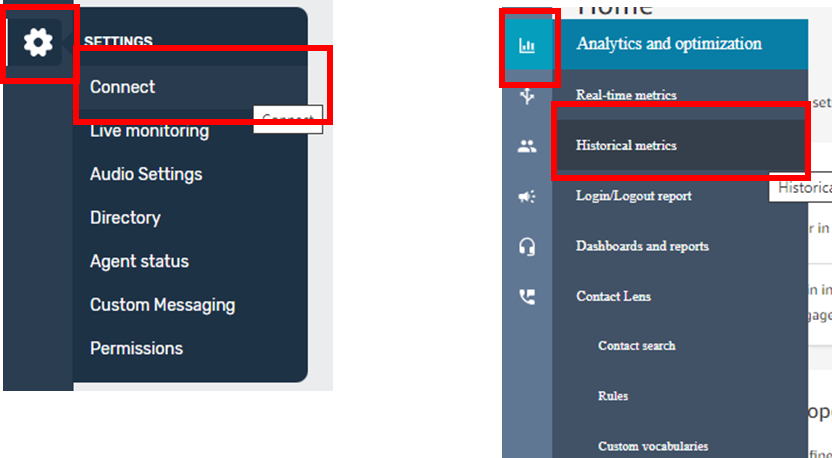
Connect can be accessed from the Settings menu – this will then open an additional tab in Amazon Connect. Historic and Realtime metrics, as well as other reporting features can be accessed from the “Chart” menu option.
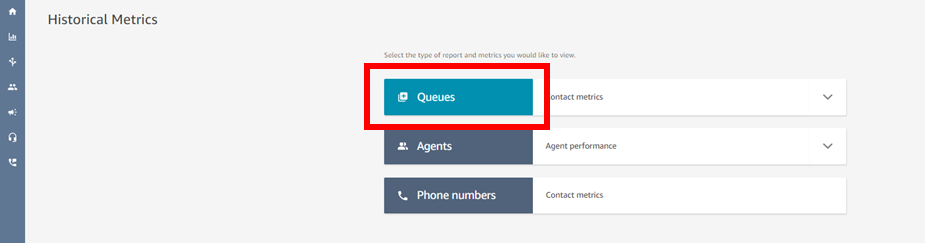
You will then be presented with some options for what type of report you want to view or create. Each option will present a “standard” report which you can then reconfigure and save or share as appropriate. Reports can be scheduled to happen at regular intervals and be formed into dashboards in the Connect reporting section.
When you open a report it will have a standard set of columns – if you select the cog on the right hand side you can select additional metric columns, use various groupings and filters to breakdown the data and amend the interval and time ranges as required.
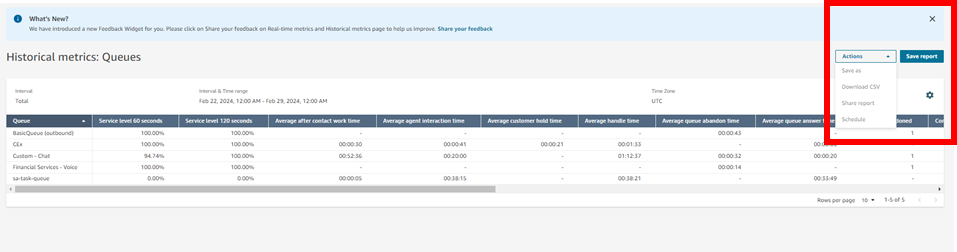
When you have the data as you need it you can save the report and give it a name. Saved Reports can be downloaded as CSV files for further processing or shared and scheduled as necessary if you have permission to do so.
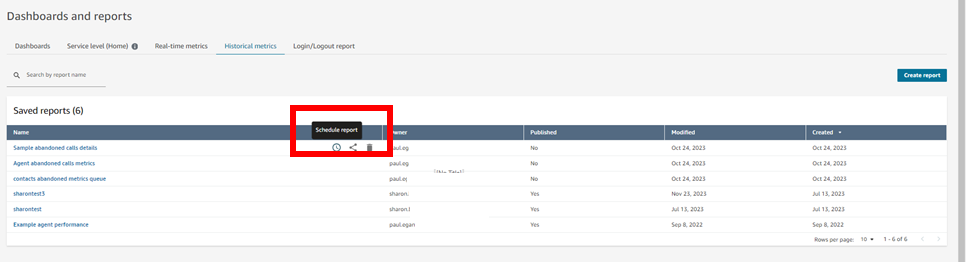
Once a report is saved it is stored in the “Dashboards and Reports” section, under the relevant tab.
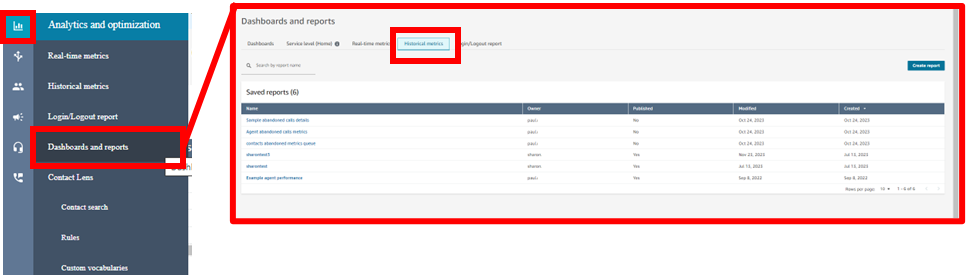
From this list page you can then select a report and delete it, or choose to share it or schedule it as required.